
What Are the 2026 Best Automated Visual Inspection Systems
Automated Visual Inspection Systems are moving from optional quality tools to core production infrastructure. On a fast conveyor, cameras check scratches, missing components, incorrect labels, and uneven seals within milliseconds. The result can trigger an air jet, stop a line, or create a traceable inspection record. Small details matter.
The International Federation of Robotics reported 541,302 industrial robots installed worldwide in 2023. Many of these systems depend on reliable vision for positioning, verification, and quality control. MarketsandMarkets also forecasts continued growth in the machine vision market, driven by electronics, automotive, pharmaceuticals, and food manufacturing. These figures show strong demand, but forecasts are not promises. Adoption still depends on lighting, integration skills, maintenance, and operator confidence.
Jeffrey Bier, a respected machine-vision industry expert, describes the field as “the use of imaging-based automatic inspection and analysis.” That definition sounds simple. Implementation is not. A reflective metal surface may confuse a camera, while dust can create false rejects. A skilled integrator must test image quality, detection accuracy, cycle time, and failure recovery. Human review remains valuable during system validation and unusual defects.
This guide examines the 2026 best Automated Visual Inspection Systems through practical criteria. It considers camera resolution, optics, lighting control, artificial intelligence, software compatibility, data traceability, and total ownership cost. Vendor claims deserve careful testing. The best system is not always the most expensive one. It is the system that detects meaningful defects consistently, explains failures clearly, and fits the real production floor.
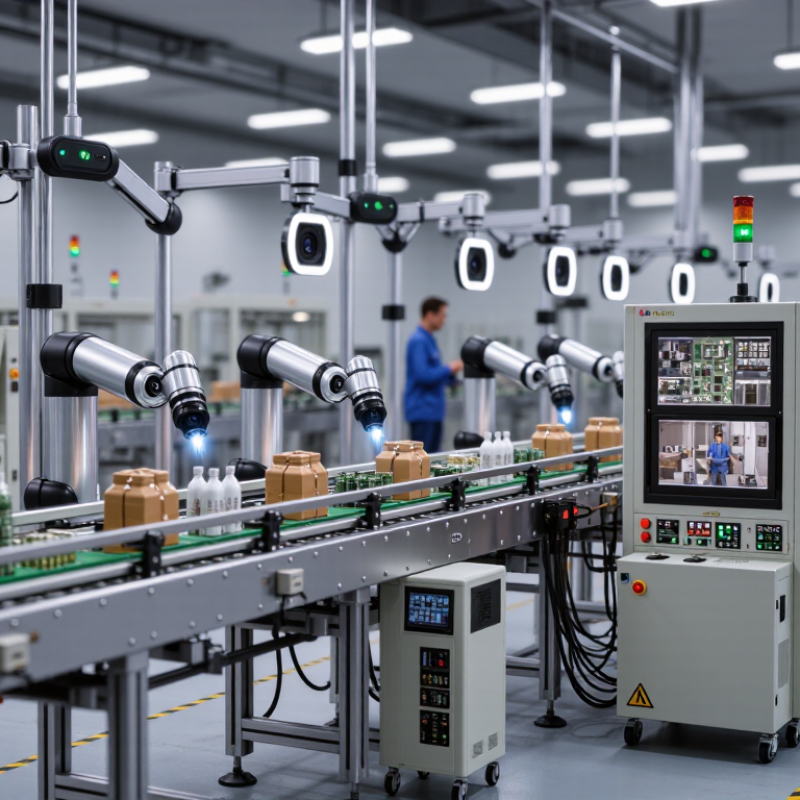
Definition and Scope: Automated Visual Inspection in 2026
Automated Visual Inspection (AVI) uses cameras, lighting, optics, and software to examine products without continuous manual checking. In 2026, its scope extends beyond simple pass-or-fail detection. Systems can identify surface defects, missing components, incorrect labels, dimensional errors, and assembly changes. They may also record images, link results to production data, and trigger a reject mechanism. The International Federation of Robotics reported 541,302 industrial robot installations worldwide in 2023. This growth supports wider inspection automation, although robots and AVI remain different technologies.
Machine vision market estimates show strong demand. Allied Market Research valued the global market at approximately 15.7 billion dollars in 2022. It projected about 31.9 billion dollars by 2032. However, market definitions vary. Some reports include cameras and sensors, while others include complete inspection platforms. That difference matters. A reliable 2026 evaluation should measure detection accuracy, false rejects, inspection speed, changeover time, and maintenance effort. Artificial intelligence can improve defect recognition, but it may struggle with reflective surfaces, poor lighting, or rare defects. Human review still has value.
Tips: Test with real production samples, including damaged and borderline parts. Record false positives, not only missed defects. Keep lighting stable. Validate the system after every major process change. The definition remains imperfect. That is worth acknowledging.
What Are the 2026 Best Automated Visual Inspection Systems - Definition and Scope: Automated Visual Inspection in 2026
| Evaluation Dimension | Definition or System Scope | Typical 2026 Capability Range | Best-Fit Inspection Tasks | Important Constraints |
|---|---|---|---|---|
| System Definition | A machine-vision system that automatically acquires images, analyzes visual features, and produces an inspection decision or measurement. | Can combine cameras, optics, controlled lighting, image-processing software, artificial intelligence, and production-line controls. | Inline quality inspection, measurement, sorting, process monitoring, and traceability. | Performance depends on sample presentation, lighting stability, camera setup, and the quality of reference data. |
| Inspection Mode | Two-dimensional, three-dimensional, multispectral, thermal, or hybrid visual inspection. | 2D imaging remains common; 3D and non-visible imaging are selected when surface geometry, depth, heat, or material differences are critical. | Surface defects, dimensional checks, presence or absence, assembly verification, depth measurement, and material classification. | Higher-dimensional sensing generally increases hardware cost, calibration effort, data volume, and integration complexity. |
| Common Defect Categories | Visual or measurable deviations from an approved product specification. | Scratches, cracks, dents, contamination, discoloration, missing parts, incorrect orientation, dimensional variation, and assembly errors. | Final inspection, incoming inspection, in-process control, and automated reject confirmation. | Very rare, previously unseen, or visually ambiguous defects can be difficult to classify reliably. |
| Image Resolution | The amount of spatial detail captured by the imaging sensor. | Selected according to the smallest defect that must be detected; many production applications use several pixels across the critical feature rather than one fixed resolution. | Fine scratches, printed characters, edge defects, dimensional inspection, and micro-assembly checks. | Higher resolution narrows the field of view, increases data-processing requirements, and may require stronger illumination or slower acquisition. |
| Processing Approach | Rule-based vision, statistical analysis, machine learning, deep learning, or a combination of methods. | Hybrid systems are practical for 2026 deployments: deterministic rules handle measurements and geometry, while trained models address variable appearance and complex defects. | Repeatable dimensional checks, anomaly detection, classification, segmentation, and OCR or code verification. | Models require representative images, controlled change management, and ongoing monitoring for data drift. |
| Decision Output | The system converts image analysis into a pass, fail, measurement, class, location, or escalation result. | Typical outputs include defect type, defect coordinates, confidence or score, measurement value, and automatic reject signal. | Closed-loop quality control, operator alerts, robot guidance, and production data collection. | A confidence score is not the same as guaranteed correctness and should be validated against defined acceptance criteria. |
| Throughput and Latency | The rate at which parts can be inspected and the time required to produce a decision. | Ranges vary from occasional or batch inspection to hundreds or thousands of items per minute, depending on part presentation, exposure time, resolution, and algorithm complexity. | High-speed packaging, continuous web inspection, electronics assembly, and discrete-part manufacturing. | Maximum line speed must be verified under production lighting, vibration, product variation, and reject-handling conditions. |
| Lighting and Optics | The optical arrangement used to make relevant features visible and repeatable. | Backlighting, diffuse lighting, dark-field lighting, coaxial lighting, polarized lighting, structured light, and controlled color or wavelength selection. | Edges, reflective surfaces, transparent parts, embossed features, texture variation, and surface contamination. | Poor lighting often creates more false rejects and missed defects than the choice of analysis software. |
| Integration Scope | Connections between the inspection system and production equipment, databases, quality systems, and operators. | May include industrial communication, programmable controllers, robot interfaces, manufacturing execution systems, dashboards, and image archives. | Automatic reject control, genealogy, audit trails, process feedback, and remote review. | Interoperability, cybersecurity, network reliability, and data-retention requirements must be addressed during system design. |
| Validation Metrics | Measurements used to confirm whether the system meets the quality and operational requirement. | Detection rate, false-reject rate, false-accept rate, repeatability, reproducibility, measurement error, uptime, and response time. | Acceptance testing, process capability studies, regulated production, and continuous performance monitoring. | One accuracy percentage is insufficient; results should be evaluated across product variants, shifts, operators, and environmental conditions. |
| Human Oversight | The role of personnel in reviewing uncertain results, labeling images, maintaining equipment, and approving changes. | Best practice is automated first-pass inspection with defined escalation paths for borderline or novel cases. | Low-volume products, complex assemblies, safety-critical inspection, and continuous model improvement. | Automation does not remove the need for trained personnel, documented procedures, and periodic revalidation. |
| Deployment Environment | The location where image acquisition and analysis take place. | Edge or on-site processing is suitable for low-latency control; centralized or cloud-connected processing supports fleet monitoring, data management, and model governance. | Factory-floor control, multi-line quality analytics, remote support, and cross-site standardization. | Connectivity loss, latency, data privacy, intellectual property protection, and environmental conditions influence architecture selection. |
| Industry Applicability | The manufacturing or logistics context in which automated inspection is applied. | Broadly applicable to automotive components, electronics, pharmaceuticals, food and packaging, metals, plastics, textiles, and consumer products. | Product conformity, safety checks, label verification, fill-level inspection, packaging integrity, and component assembly. | Sector-specific regulations, hygiene rules, validation expectations, and defect definitions must be incorporated into the inspection specification. |
| Selection Priority for 2026 | A practical framework for identifying the most suitable automated visual inspection system. | Prioritize defect detectability, validated performance, line compatibility, maintainability, explainability, integration readiness, and total cost of ownership. | New system selection, modernization of manual inspection, and expansion of existing machine-vision programs. | The system with the most advanced algorithms is not automatically the best choice if the imaging, workflow, validation, or service model is unsuitable. |
Note: Capability ranges are application-dependent planning references rather than universal performance guarantees. Final suitability should be established through representative production trials and documented validation.